Follow along with our video tutorial or via the steps below
Step by Step: Adding your Data
Bothan has a fully functional API for developers to add data to their own Bothan instance, but if you’re not a developer, it’s still easy to add data to your Bothan without writing a single line of code!
This tutorial will show you how to use the Bothan recipe in Zapier to add data from a Google spreadsheet to your Bothan instance.
Before getting started, make sure you sign up for a Zapier account at https://zapier.com/sign-up. This tutorial will work with a free account, but a paid account will allow for much more complicated integrations and a greater number of steps.
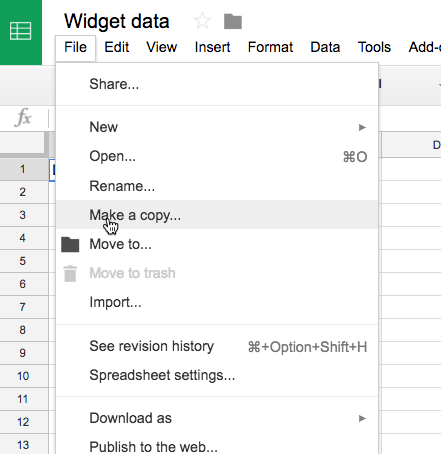
Once you’re all signed up, open up this Google spreadsheet in your browser, and make a copy by going to File > Make a copy in the Google apps menu bar as shown:
Then, add the Bothan Zapier app to Zapier using this link
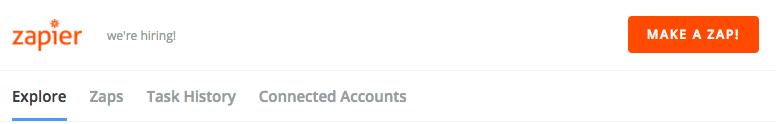
Once you’ve done this, go to zapier.com, log in and click “Make a Zap!”:
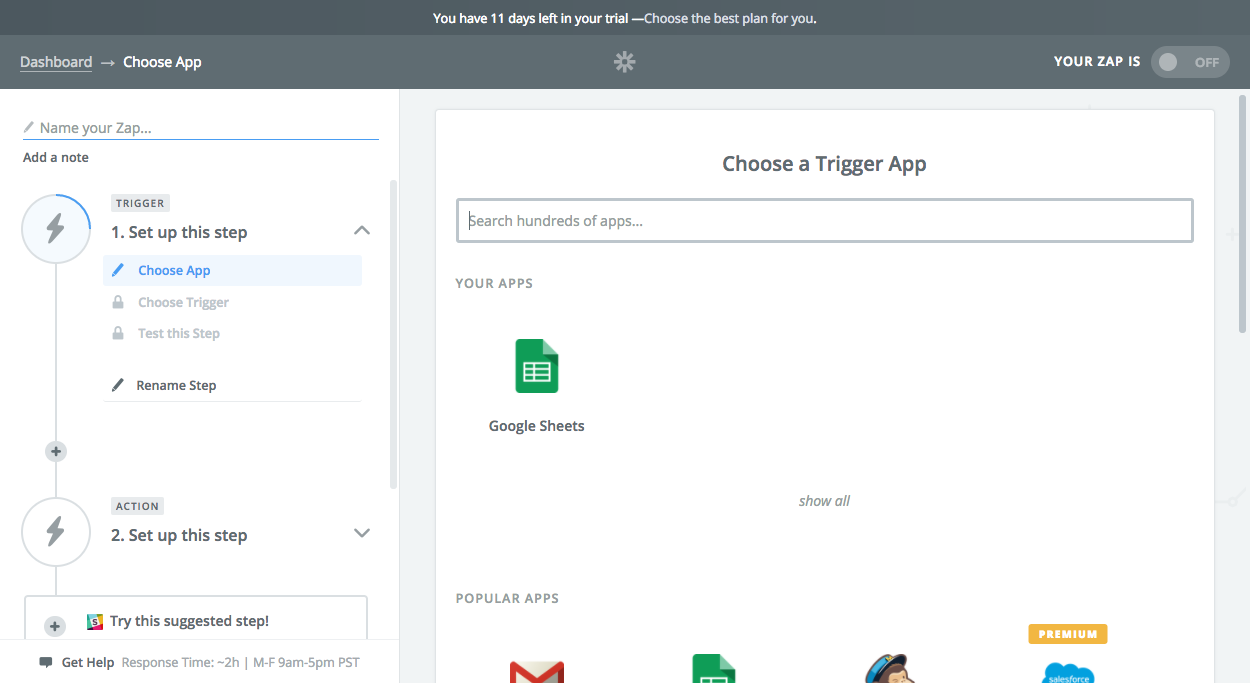
Once you’re on the New Zap page, the next thing to do is add your Trigger. Under ‘Choose a Trigger App’, select “Google Sheets” (you may need to search for this in the box marked ‘Search hundreds of apps’)
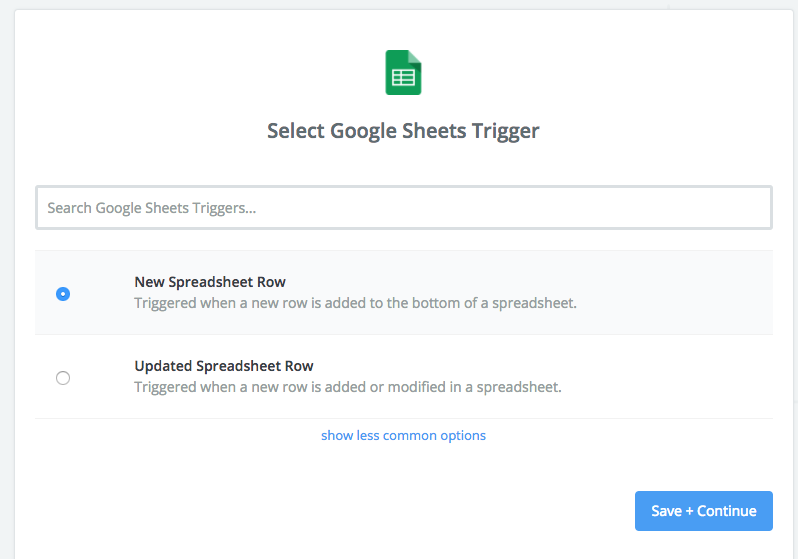
Next, we want to choose a trigger for the zap. When this event is triggered, Zapier will take data from our spreadsheet and run the app. Here we want to choose ‘New spreadsheet row’, so every time a new data point gets added, it gets added into Bothan automatically:
Next, you’ll need to authenticate with your Google Drive account. Click ‘Connect a new account’ and follow the onscreen prompts.
You can then click ‘Test’, and if everything works correctly, click ‘Save and continue’ to move on to the next step.
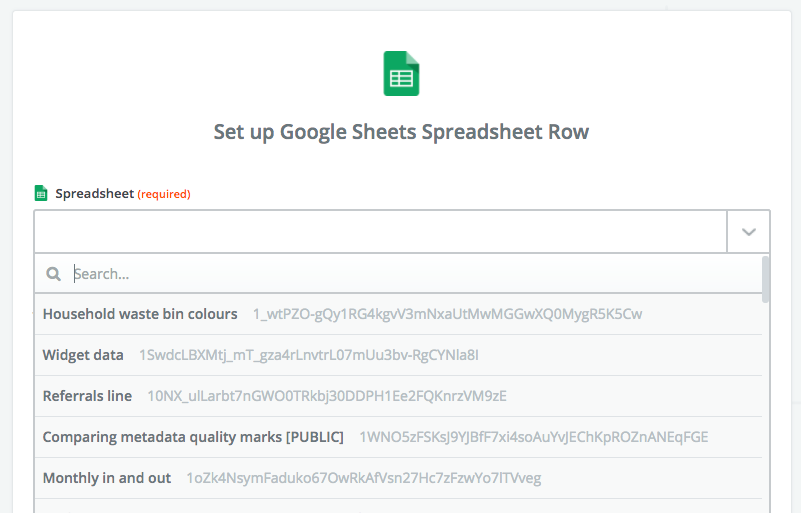
Next, we want to choose the spreadsheet we are going to get our data from. If you click the Spreadsheet drop down menu, you should see the spreadsheet you copied at the top of the list (Widget data). If not, you should be able to search for it and select it
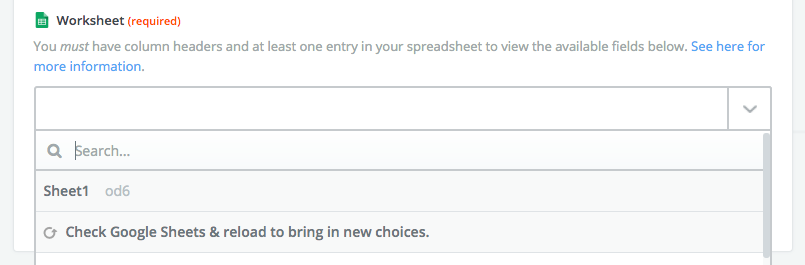
Next, select the worksheet from the second drop down. This is easy, as there should only be one ‘Sheet 1’. Click ‘Continue’
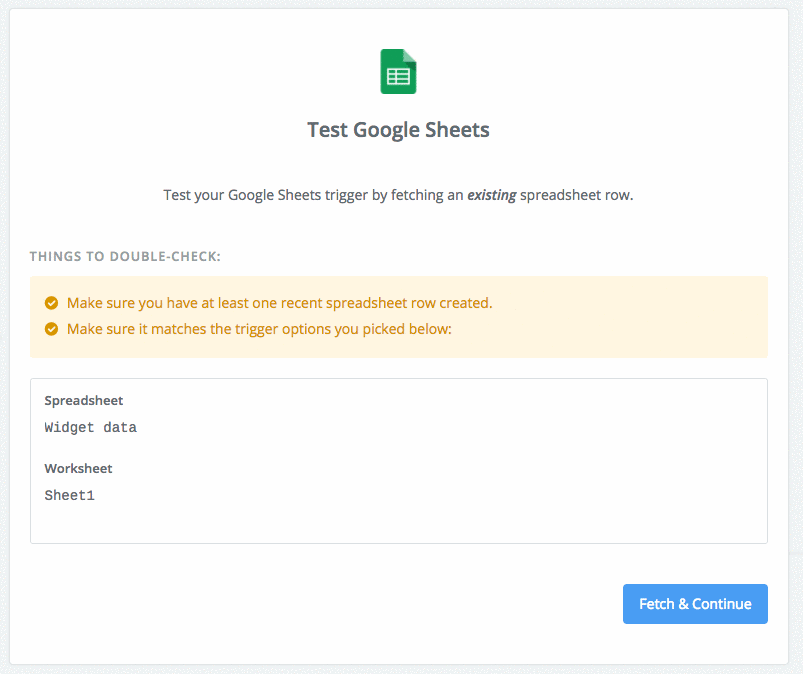
Zapier will now test to see if it gets any data. Click ‘Fetch and continue’, and you should see that the test has been successful.
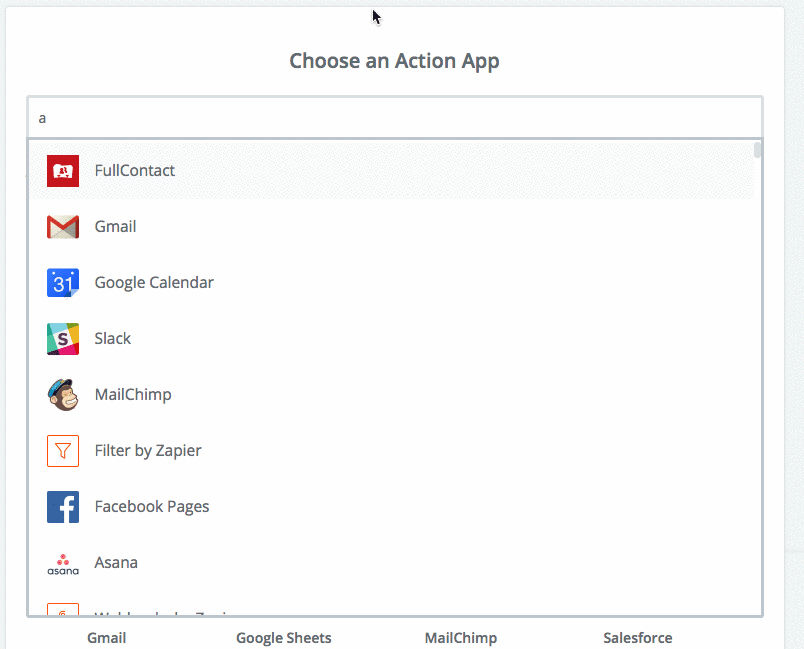
Click ‘Continue’, and you’ll be automatically moved to the ‘Choose an Action App’.
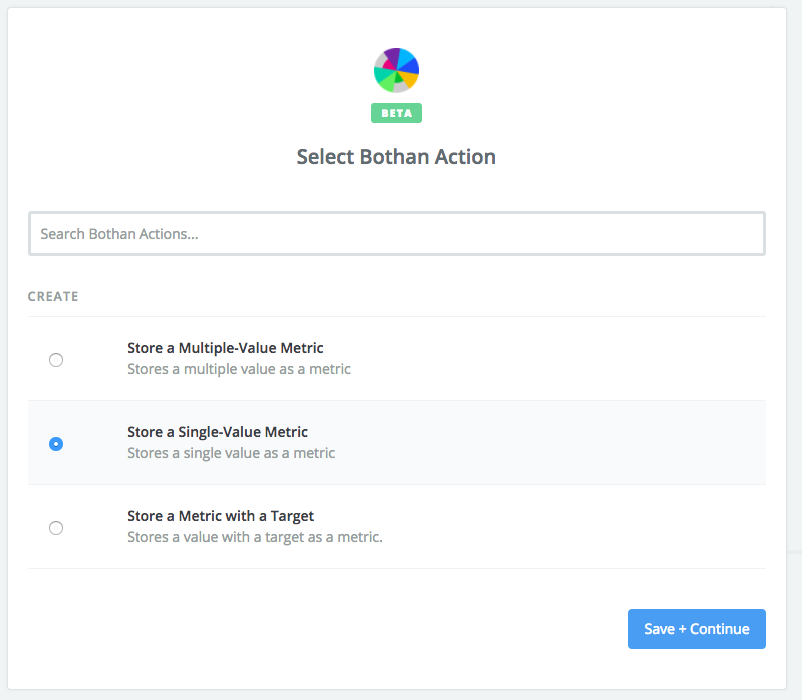
In the search box, search and select ‘Bothan’. If you can’t see Bothan, make sure you’ve added it to your account using this link.
You’ll then see a couple of options for the type of metric you want to add. Choose ‘Store a single-value metric’.
Next, you’ll need to add your Bothan account to Zapier. Click ‘Connect a new account’ and you’ll see a screen like this one pop up:
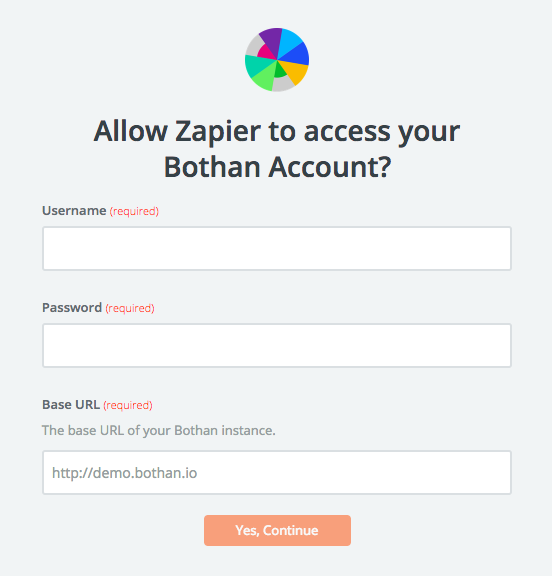
Enter the username and password you provided when you setup Bothan, as well as
the URL of your Bothan instance (this should be something along the lines of http://my-awesome-bothan-instance.herokuapp.com unless you’ve changed it).
Click ‘Yes, Continue’, and then ‘Save and Continue’ once the pop up window closes
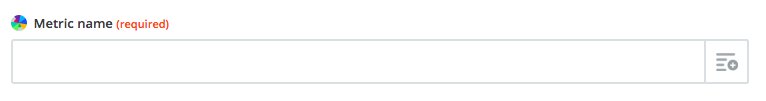
Next we come to adding the data. In the metric name box, type the name of your metric. This will probably be something like ‘Widgets sold’ for our example, but you can use anything you fancy
Next, we’re going to pick the actual value for our metric. In the value box, click the ‘Insert a field’ button. This will bring up a list of fields from our spreadsheet. Choose ‘widgetsmade’ (you may need to scroll to see this)
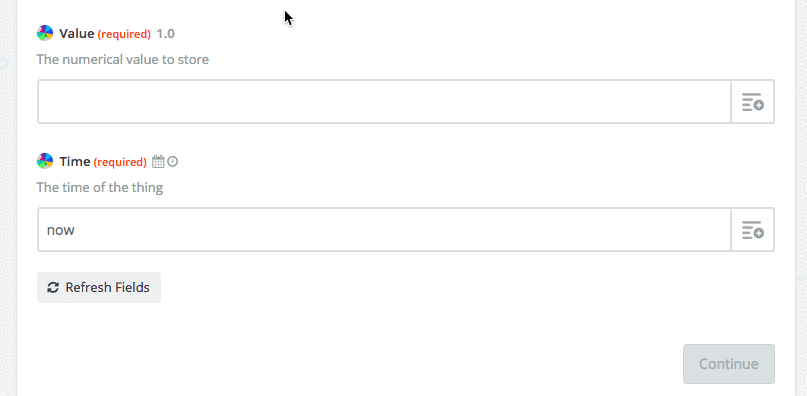
We then want to choose the date for the metric. First delete the text that says now, click on the
‘Insert a field’ button, and choose ‘date’ (again, you may need to scroll to see this)
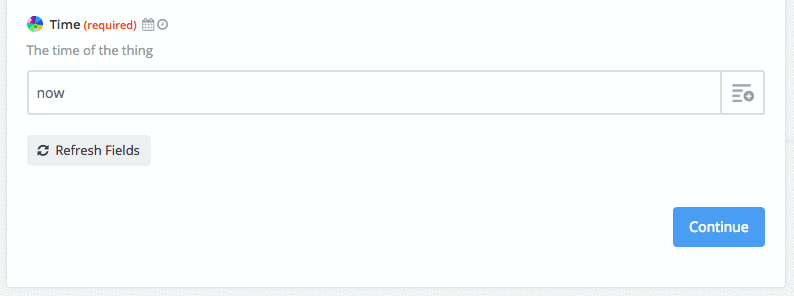
Next, click ‘Continue’, and Zapier will ask you to confirm your choice and test your step. Click ‘Create and continue’.
You should then see ‘Test Successful!’, and click ‘Finish’. You can then name your zap and activate it by moving the ‘off’ slider to ‘on’.
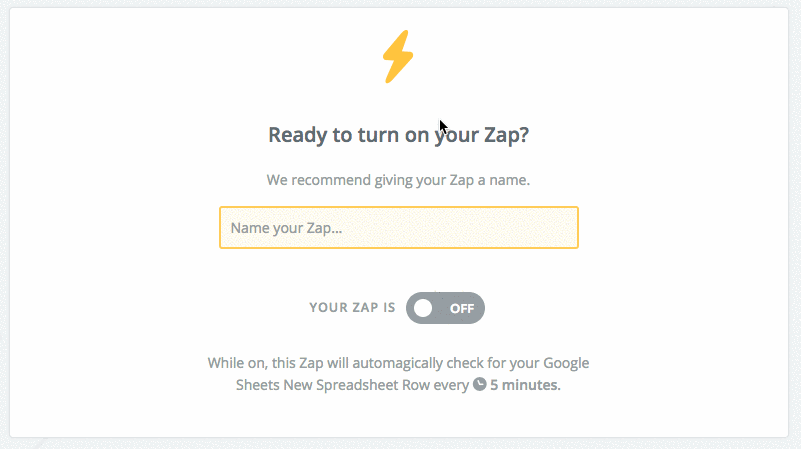
Now, every 15 minutes, Zapier will check for any new data, and if it’s present, it’ll be added automatically to your Bothan metric!
Next, repeat the process again, but choose the ‘widgetssold’ column instead of ‘widgetsmade’ when creating your metric. You’ll now have two metrics, and you’ll be ready to create a dashboard!