Follow along with our video tutorial or via the steps below
Step by Step: Building Your Dashboard
One of Bothan’s most powerful features is the ability to build your own dashboards from your data. This guide will show you how to build a data-driven dasboard using the data you’ve set up in the adding data tutorial.
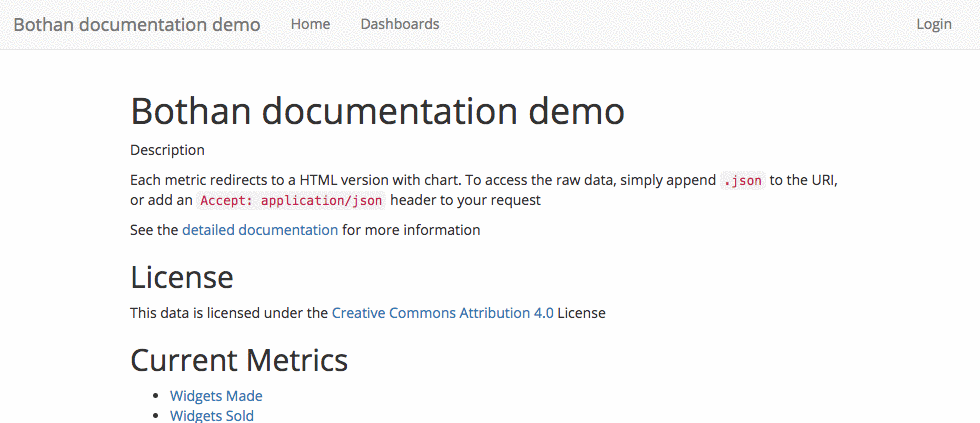
The first thing to do is to go to the homepage of your Bothan instance, click the ‘login’ link, and login to the system using the username and password you provided when installing your Bothan
Next, click on ‘Create Dashboard’. You’ll then see a form that will allow you to design and create your own dashboard:
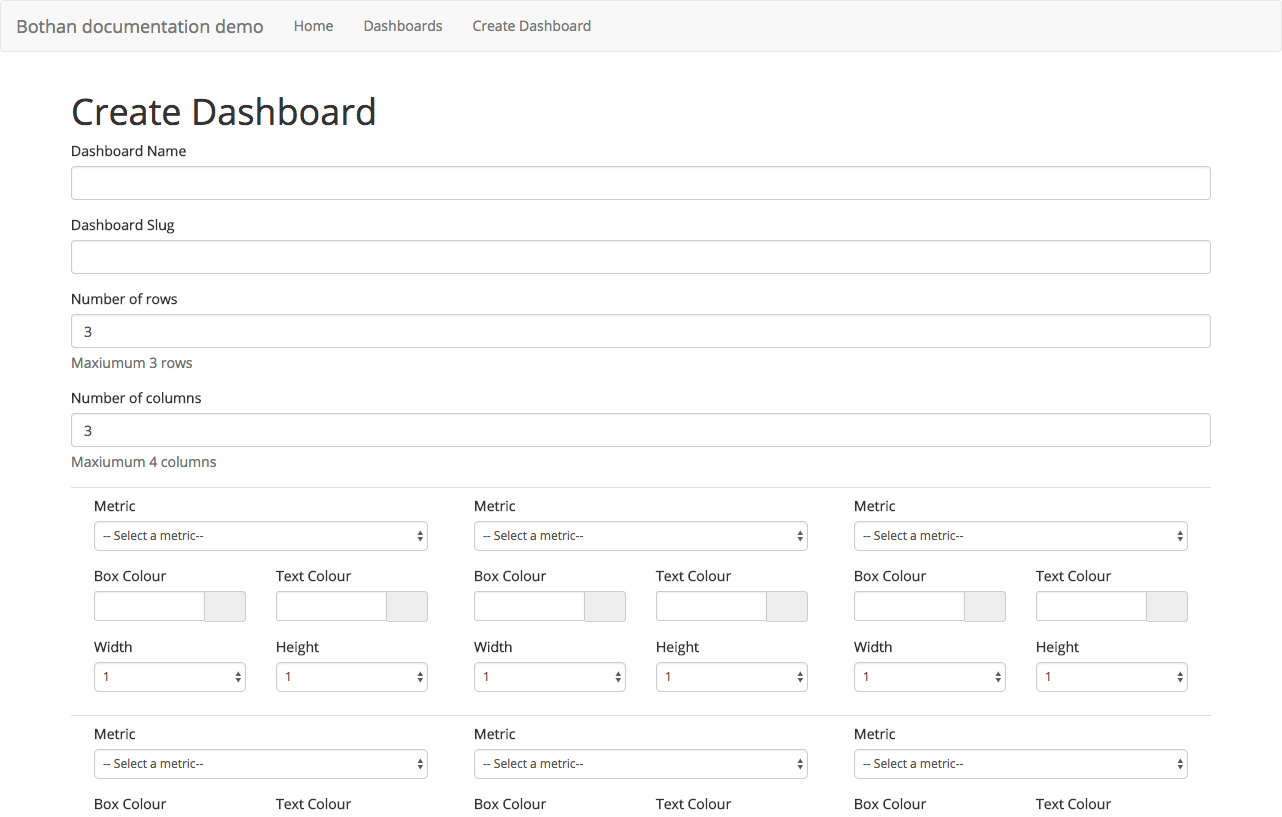
The first thing you’ll need to provide is the name of your dashboard. This will be shown on the top of the page when your dashboard has been created

In the next field, Bothan will use your name to give you a dashboard identifier, or ‘slug’, which will be used in the URL of the dashboard. You can change this if you want, but the slug must only contain lowercase letters, numbers and dashes

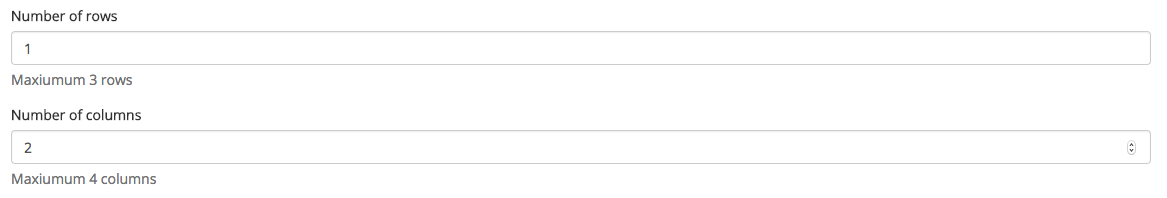
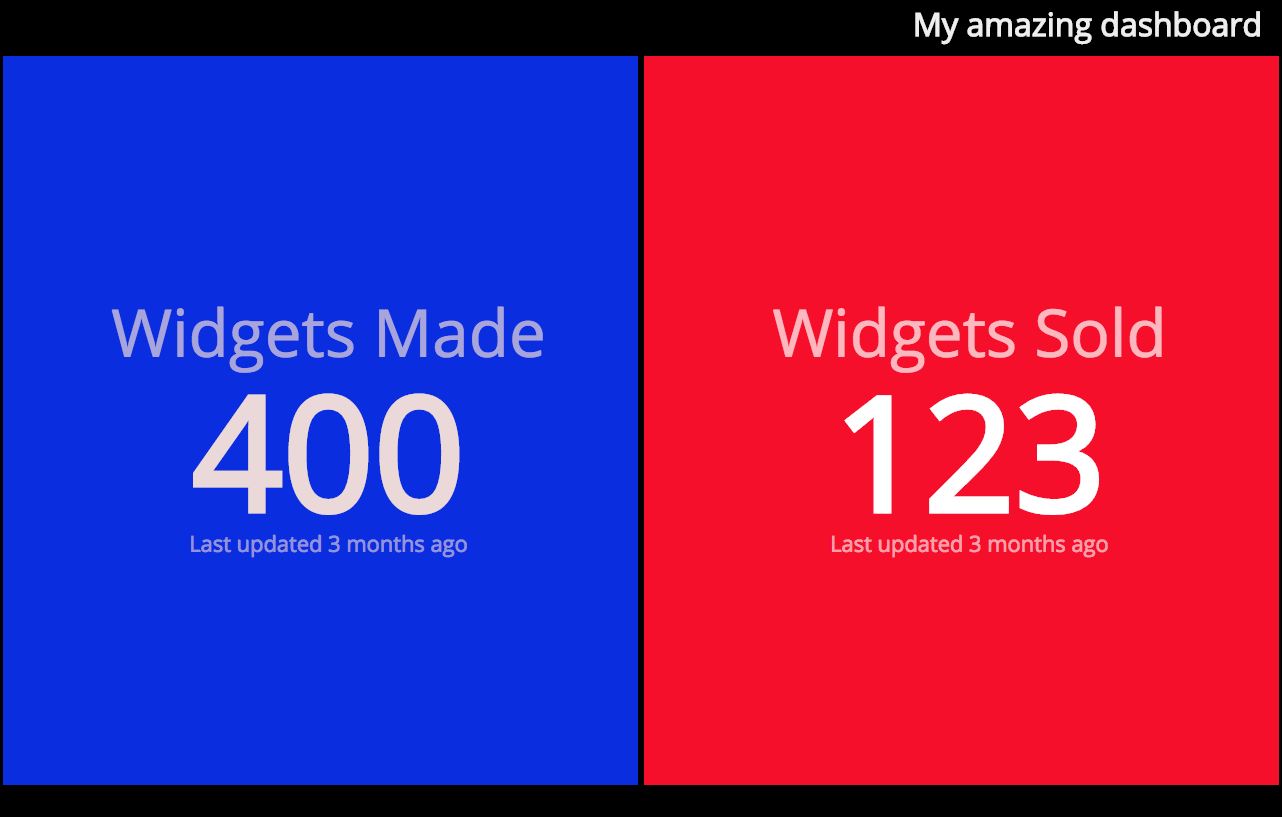
Next, you’ll be able to build your layout, specifying the number of rows and columns. As we only have two metrics (and to keep things simple), we’ll choose one row and two columns
As you change the number of rows and columns, the form fields below will adjust to reflect your layout. As we’ve chosen one row and two columns, you should now see two sets of form fields, side by side
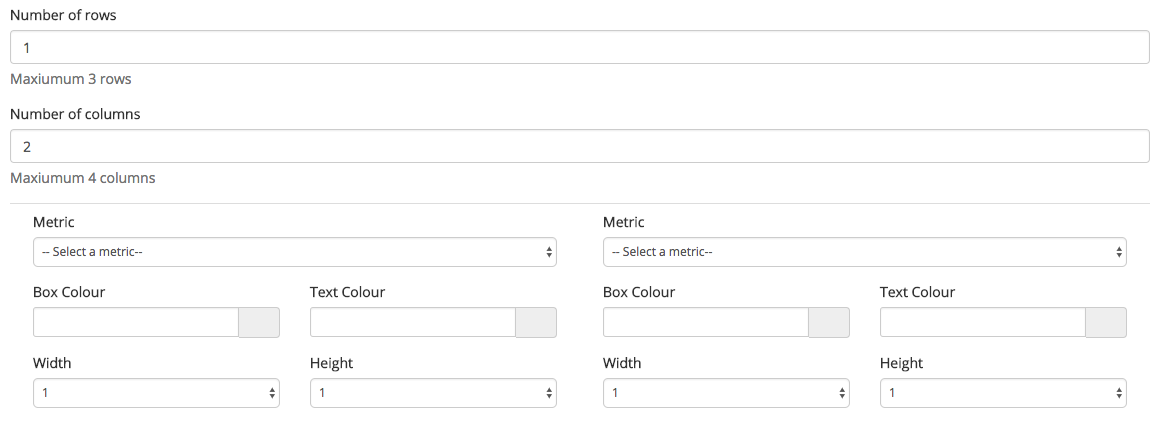
Each of these sets of form fields will allow you to choose what metric your dashboard cell will show, as well as visualisation options.
In the first cell, we’ll choose ‘widgets-made’. When you change this, the cell will update to show a preview of what your metric will look like. At the moment, this will attempt to show a chart, and, as there’s only one data point, this looks a bit odd. Scroll down slightly, and you’ll be able to change the view to a number. Again, this will update the preview.
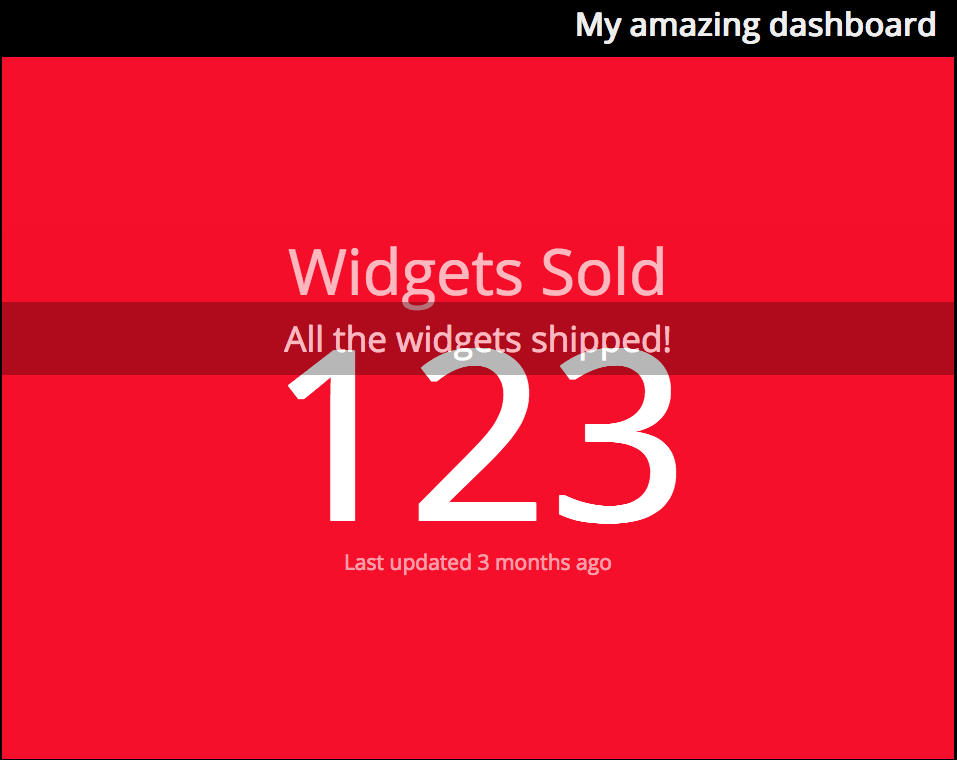
There is already a title displayed in the preview, but if you want to change this, you can update this in the ‘title’ field:
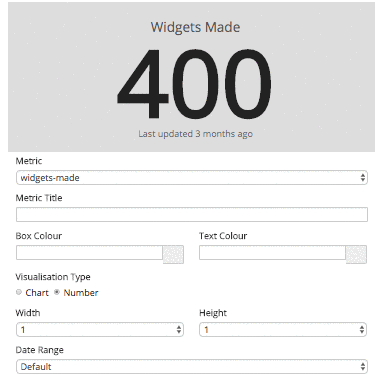
You can also alter the colour of the metric with the background and text colour pickers. This will update as you change it.
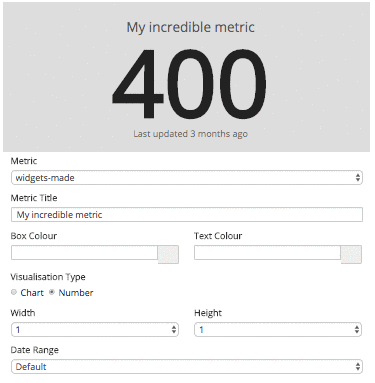
Once you’re happy with your metric, repeat the procedure with the next cell along, but choosing the ‘widgets-sold’ metric.
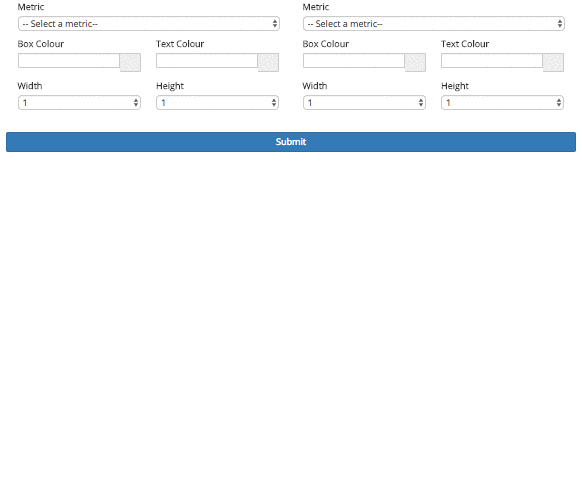
Finally, click ‘Submit’ and you will be redirected to your new, shiny dashboard!
If you want to make any changes, you can do so by navigating back to your Bothan instance, going to the dashboards page, and then clicking ‘edit’ by your dashboard.
Any changes you make to your metrics - such as new titles - in a dashboard are only saved for that dashboard. The underlying metrics end-points will keep their original title, which defaults to the endpoint created. You can edit a metrics title more permanently by Editing the Metadata.
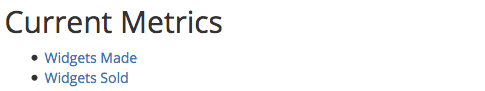
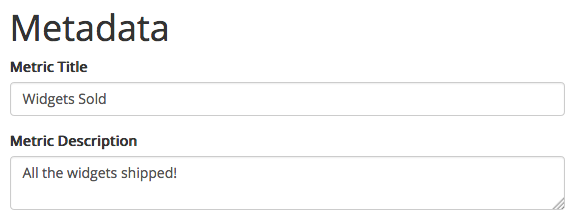
Go back to the homepage of your Bothan instance and ensure you are still logged in. Click into the metric whose metadata you wish to edit, like widgets-sold
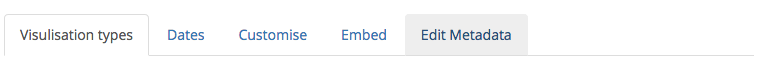
On this screen you can amend several aspects of a metrics metadata by clicking the Edit Metadata tab. We’re going to edit just two for now.
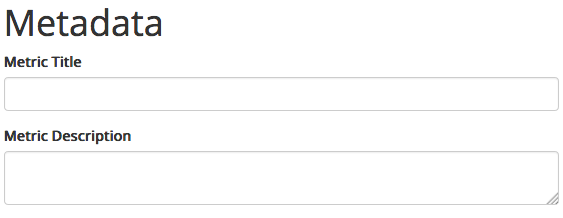
If you amend The Title then the metrics title will permanently reflect whatever you enter when you visit that metrics URL
The second box Metric Description also provides data that will update on any dashboard you create.
In this field you can provide a description of the metric which display to all users when they mouseover the tooltip
portion of the graphic located at the top of the graphic.
If you add a description for Widgets Made then the tooltip bar in the dashboard will reflect whatever you type. Type your description and click submit. This descriptuon will be updated for the metric endpoint and any dashbaords that include that metric. If you go back to your dashboard you should this updated.