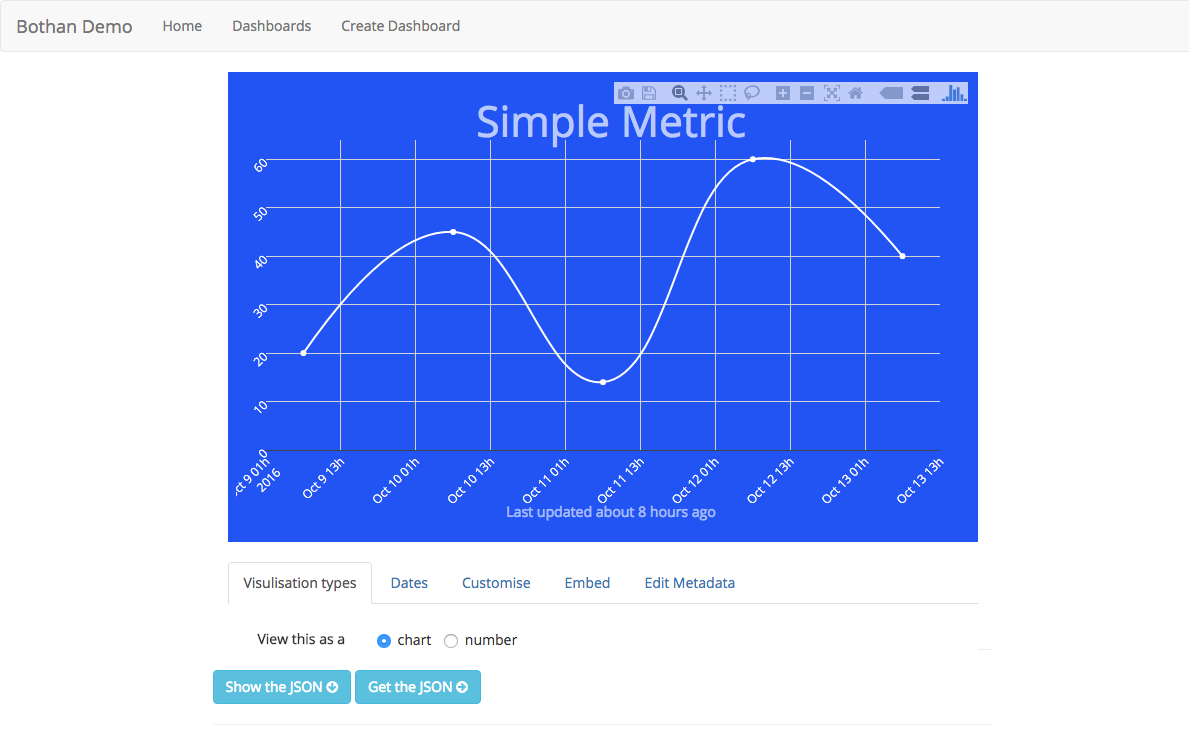
Once you have data, you can then visualise it in a number of different ways, depending on the metric. You can explore these on your individual metrics page (for example https://demo.bothan.io/metrics/simple-metric/), or manipulate options via query strings.
You will also be able to copy and paste embed code for a metric as an iframe.
Showing a metric’s visualisation
GET https://demo.bothan.io/metrics/{metric_name}/{from}/{to}
(or GET https://demo.bothan.io/metrics/{metric_name} which will redirect to a default time-range of the last 30 days)
query-string options
The rendering can be manipulated by the following query-string options:
type
One of:
chart, which renders a Plotly line chart of the data:
number, which displays the latest value from the metric:
pie, which renders a Plotly pie chart of the data, as best it can. This is only supported by the multiple values metric type:
target, which renders a meter style chart with an actual value, an annual target value and a year to date target value. This is only supported by the value with target metric type:
map, which renders a Leaflet.js map rendering. This is only supported by the geographical data metric type.
Default: By default, Bothan will attempt to work out the best visualisation for your metric
layout
One of:
rich, with a nav-bar and other controls, orbare, a minimal layout designed for inclusion elsewhere as an iframe
Default: rich
boxcolour
Background colour for the chart or number, in hex. Note that you should not pass the leading #. Also note the English spelling
Default: ddd
textcolour
Text colour (and line colour for the chart), in hex. Note that you should not pass the leading #. Also note the English spelling
Default: 222
autorefresh
meta-refresh interval for the page
Default: none
title
The title for the metric. This defaults to a titleized version of the metric (for example, my-cool-metric will display as My Cool Metric)
Example: https://demo.bothan.io/metrics/simple-metric?boxcolour=fa8100&textcolour=00ffff&layout=bare
tiles
The name of the tileset to use when visualising a map. Can be any one of the following (click to see a preview):